Forensic Analysis

February Conversion
Data Anomaly

A day-by-day investigation of conversion data in February 2026 revealing a batch data import that inflated reported ROAS from 273% to 351%.

01
Something happened Feb 9–13

vega Sales conversions (confirmed Shopify purchases) jumped from a normal ~190/day to over 2,600/day — while ad spend stayed flat. This is physically impossible from advertising alone.

Feb 1
198
$8,567
Feb 2
233
$7,291
Feb 3
195
$7,753
Feb 4
170
$5,654
Feb 5
212
$5,768
Feb 6
143
$6,359
Feb 7
199
$5,854
Feb 8
234
$6,451
Feb 9
871
$5,962
Feb 10
1,790
$6,723
Feb 11
2,521
$8,009
Feb 12
2,664
$8,098
Feb 13
918
$7,553
Feb 14
207
$6,853

Red bars = vega Sales conversions. Right column = daily ad spend. Notice how spend barely changed ($5.9K–$8.1K range) while conversions exploded 786%. Real ad purchases don't behave this way.

02
Spend +8%. Conversions +786%.

Comparing the 8 normal days (Feb 1–8) to the 5 anomaly days (Feb 9–13):

Normal Days (Feb 1–8)
198
avg conversions / day
Anomaly Days (Feb 9–13)
1,753
avg conversions / day
Normal Spend / Day
$6,706
average daily ad spend
Anomaly Spend / Day
$7,269
only 8% higher
Normal Conv / $1K Spend
29.6
conversions per $1K
Anomaly Conv / $1K Spend
241.1
8.1x higher efficiency — impossible from ads

The math doesn't work. If these were real ad-driven purchases, $7,269 in ad spend would need to generate 1,753 Shopify transactions at $41.48 average order value. That's a $4.15 cost per purchase — 12x better than any other day in the account's history.

03
Two conversion actions spiked simultaneously

Both vega Sales (one-time purchases) and Purchase–Subscription (recurring) experienced identical spike patterns on the exact same 5 days. This confirms a system-level data event, not organic sales.

Date vega Sales Conv vs Normal Subscription all_conv vs Normal Combined Anomaly
Feb 8 (baseline)2341.0x1441.0x
Feb 98714.4x7925.5x1,663
Feb 101,7909.0x1,66611.6x3,456
Feb 112,52112.7x2,35716.4x4,878
Feb 122,66413.5x2,56917.8x5,233
Feb 139184.6x8055.6x1,723
Feb 14 (return to normal)2071.0x1330.9x
16,953
Total excess conversions across both actions during the 5-day anomaly window
$161K
Excess vega Sales value attributed to ad campaigns during the spike vs normal daily average
5 days
The anomaly started Feb 9, peaked Feb 12, and fully resolved by Feb 14 — a classic batch import curve
8%
Ad spend only increased 8% during the spike — confirming these were not ad-driven purchases
04
Every day, every number

Complete daily breakdown showing spend, vega Sales conversions, revenue, and single-day ROAS. Red rows are the anomaly days.

Date Spend vega Sales Conv vega Sales Rev Day ROAS Flag
Feb 1$8,567198$21,729254%
Feb 2$7,291233$20,055275%
Feb 3$7,753195$20,127260%
Feb 4$5,654170$16,680295%
Feb 5$5,768212$16,788291%
Feb 6$6,359143$13,921219%
Feb 7$5,854199$16,876288%
Feb 8$6,451234$21,690336%
Feb 9$5,962871$34,774583%ANOMALY
Feb 10$6,7231,790$50,002744%ANOMALY
Feb 11$8,0092,521$61,723771%ANOMALY
Feb 12$8,0982,664$63,632786%ANOMALY
Feb 13$7,553918$42,724566%ANOMALY
Feb 14$6,853207$20,025292%

Pattern: Normal days (Feb 1–8, Feb 14+) show 143–234 conversions/day. The spike starts Feb 9, peaks Feb 12 at 2,664 conversions, and drops back to normal by Feb 14. This ramp-up → peak → tail-off is the signature pattern of a batch data import processing over several days.

05
February reported ROAS was inflated by $161K

Removing the excess conversion value from the 5 anomaly days reveals the true February performance:

Reported February

351%
$730,092 conv. value
$208,119 spend

Includes ~$161K in phantom
revenue from batch import

Corrected February

273%
~$569,000 conv. value
$208,119 spend

Based on normal daily average
of ~192 conv / $18,326 per day
Phantom Revenue
$161K
excess vega Sales value from batch import
ROAS Inflation
+78pts
351% reported vs 273% actual
Excess Conversions
7,804
vega Sales conversions above normal baseline
True Feb Performance
273%
still strong — real purchases, real ROAS
06
The spike is visible in the Google Ads dashboard

This chart from the Google Ads account shows cost (blue) staying flat while conversion value (green) and conversions (orange) spike dramatically in mid-February — the visual fingerprint of a data import.

Google Ads dashboard showing February conversion spike
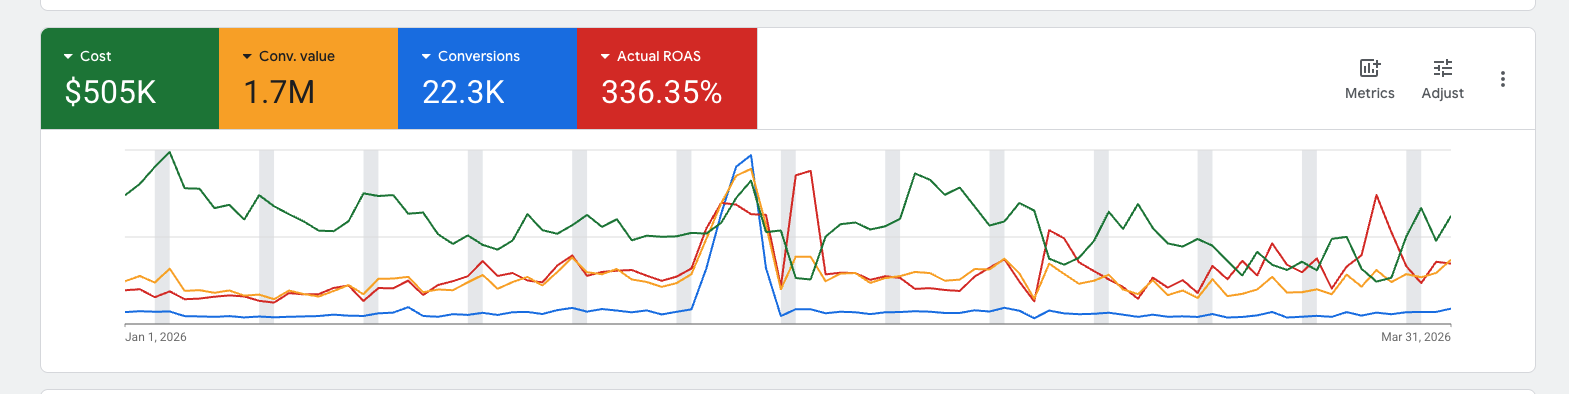
Google Ads Account Overview — Jan 21 to Apr 20, 2026. The mid-February spike is clearly visible.

What you're seeing: The green line (Conv. value) and orange area (Conversions) both spike dramatically while the blue line (Cost) remains completely flat. This pattern — unchanged spend with an explosion in conversions — is the definitive indicator of historical data being imported into the conversion tracking system.

07
The data is clear. Here's the summary.

Key findings from the forensic analysis of February 2026 conversion data:

08